Residential, The High End
The high-priced end of the Greater Boston single-family market is represented by
towns like Weston, Wellesley, and Dover. There may be higher-priced housing in
Brookline, but not as much of Brookline is single-family, and the picture there
is clouded by condominiums, small rental properties, and extensive conversions
and upgrades undertaken in the past two decades. The Warren Group measures
single-families as a separate category. For a simple single-family price trend
measure, the market outside Route 128 is best.
The price trend for Weston single-family houses is shown in the graph that follows.
The trend displays the Weston median single-family house price from 1987 to 2015.
The median is the middle price in a group. If 101 houses sold in a year, it is
the price in the middle, with 50 houses priced higher and 50 lower.
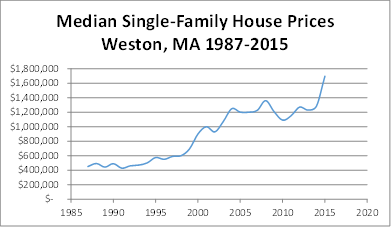
The median is not a "pure" measure: houses changed from 1987 to 2015. New houses
grew larger. All houses aged. But the median remains a good measure for Weston.
In any year, the median house was not a brand new house. In 1991, the house at
32 Orchard Avenue in Weston sold at about the 1991 median price. It was a 19-year-old
Cape with 3,355 square feet of living space and five bedrooms on a site of 60,436
square feet. In 2011, the house at 36 Robin Road sold at about the 2011 median
price. It was a 53-year-old Cape with 3,182 square feet of living space and four
bedrooms on a site of 83,087 square feet. The median house may have changed
somewhat, but not enough to skew the results substantially. The median appears
in this case to be a good yardstick for price change at the top.
One trend that may have suppressed prices in Weston since about 2000 is the trend
to urban living. In 1990, the high-end Weston house was the best residence in
the Greater Boston market. By 2010, much of the high-end demand had shifted to
the Back Bay and Beacon Hill. A study of price trends for townhouses and
condominiums in Boston would show prices trending up much more steeply. The
highest-priced residence in Boston in 1990 was the townhouse at 22 Louisburg
Square on Beacon Hill, a 6,003-square-foot building that sold for $2,900,000.
In 2015, it was a condominium at Heritage on the Garden (300 Boylston Street),
a 5,083-square-foot unit that sold for $15,400,000. No houses in Weston sold in
2015 for more than $9,000,000.
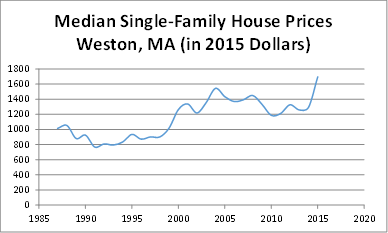
The graph presented previously was not time-adjusted. Prices for Weston houses
went up from 1987 to 2015, but so did the prices for pretty much everything else.
The increase may be attributable to nothing more than inflation. To answer
whether that is so, we need to look at the data in time-adjusted, inflation-free
dollars. The graph that follows shows the Weston median single-family price,
time-adjusted to 2015 dollars. It takes inflation out of the equation. The
graph shows Weston's time-adjusted median single-family price declining from a
late 1980s peak, then rising to produce real (and not simply inflation-derived)
growth in value since 1999.
Weston's single-family market showed strong growth for the past two decades, in
spite of the shift in demand for high-end housing from the suburbs to the city.
Click here for The Middle
About Us
Eric Reenstierna Associates LLC is a real estate appraisal firm taking on valuation and consultation assignments in Greater Boston, Massachusetts and New England. Eric Reenstierna, MAI, is the office's principal and is a commercial real estate appraiser.
Explore
Contact
24 Thorndike Street
Cambridge, Massachusetts 02141
(617) 577-0096
ericreen@tiac.net